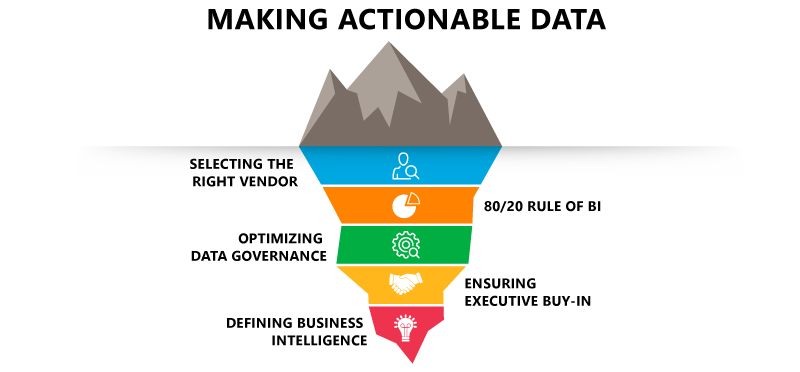
Today, business intelligence is often thought to be synonymous with data visualization dashboards. Indeed, dashboards may be the face of business intelligence at any organization.
They are our most powerful tool for communicating actionable data. But dashboards are the proverbial tip of the iceberg. Below the surface is where the bulk of BI work takes place and is also where the majority of obstacles occur that can stop successful business intelligence implementation in its tracks. Let’s review some of the most common obstacles an organization may run into and how to clear the way for actionable data.
Defining Business Intelligence
Business intelligence is leveraging your data to your strategic advantage. It encompasses both tools and techniques required to fully utilize an organization’s data. But business intelligence requires more than technical skills and data visualization platforms. It is also a mindset that requires a BI professional to think holistically about an organization’s data, its executive priorities, and its end-users.
Ensuring Executive Buy-In
Convincing executives is often the first major hurdle in a BI implementation plan. Without it, a plan has little way forward. These days it is becoming easier to demonstrate the transformative power of BI with compelling and effective data visualizations. There are plenty of examples to show how nonprofits are leveraging their data and transforming their workforces. Yes, implementation takes time and financial investment, but the amount of time saved by not doing manual analysis is dramatic.
Instead of manual tasks that take days of a teammate’s time to complete, staff can focus on strategy, decision making, and innovation. It is easy to gloss over the investment of time the BI plan takes and focus on the result. This approach may ensure short-term buy-in, but it’s at the expense of the long-term success of the project. Executives should have a clear roadmap and a realistic understanding of the steps involved, starting with a foundation of proper data governance.

Optimizing Data Governance and the 80/20 Rule of BI
Creating and implementing a business intelligence plan requires significant forethought and strategy. Unfortunately, many organizations cannot just plug their database into a BI platform and expect high quality results. If an organization does not already have a proper data governance structure in place, the data represented in your dashboards could be misleading and in the worst cases, inaccurate.
Instead, start with ensuring data systems are optimal: assessing data integrity and security and ensuring there is appropriate documentation (such as data dictionaries) as well as user adoption and compliance to business rules. This may take several layers of an organization to achieve and should be accounted for in your implementation timeline.
But the groundwork is not finished once you have the governance in place. Even after ensuring data governance and selecting a BI platform, about 80 percent of the work to create dashboards is developing the dataset. This requires a good understanding of the database and its tables and relationships. Then, views or models must be created to connect the database to the BI platform, which should be tested to ensure data quality. Only then are you ready for the last 20 percent of the work—determining metrics and creating the corresponding visuals.
Selecting the Right Vendor
There are dozens of tools on the market to analyze and visualize data. Instead of asking which vendor is best, ask which vendor is best for your organization. Each organization has different reporting needs, existing CRMs, skill sets, and budgets. These are all important considerations, and an organization should be clear on its business needs before considering which vendor is “best.”
You may find that your preferred vendor is different than you initially thought because you discover a member of your team has previous experience with one, or your budget for the next fiscal year changes, or your data source is well suited to a particular platform. Ask questions and gather perspectives from your IT team and from your colleagues who will represent your end users to ensure you have considered all angles before choosing a vendor.
Making Data Actionable
Many BI professionals can probably recall a time when they came into a meeting thinking they were going to discuss strategy and ended up spending most of the time talking about the data. Answering questions and being transparent is part of trust building, but the goal of business intelligence is to shift the conversation away from the data itself and to the insights, actions, and strategy you can derive from your data—data that is clean, well-visualized, and accessible.
With well-managed executive buy-in, proper data governance, and the right BI platform, pivoting the data conversation to actionable insights should be the last, and easiest, obstacle to overcome.
Let Us Help
Let the BWF experts show you how to maximize your BI efforts by building, designing, and deploying an effective BI solution. We help clients create the right metrics and KPIs that communicate and align behavior with strategy; develop models for predictive analytics and business simulation; and provide BI development, training, and implementation for organizations that lack the resources, be it time or technical staff.
To learn more about how business intelligence can improve your fundraising operations, contact Reed Tyler or Kaitlin Dunn Mickelson.


